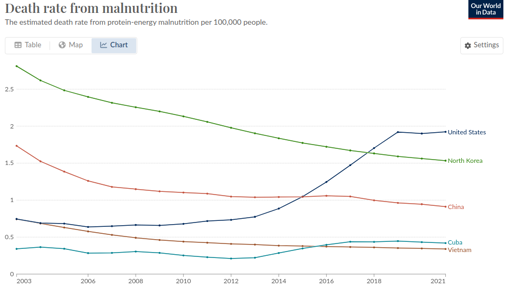
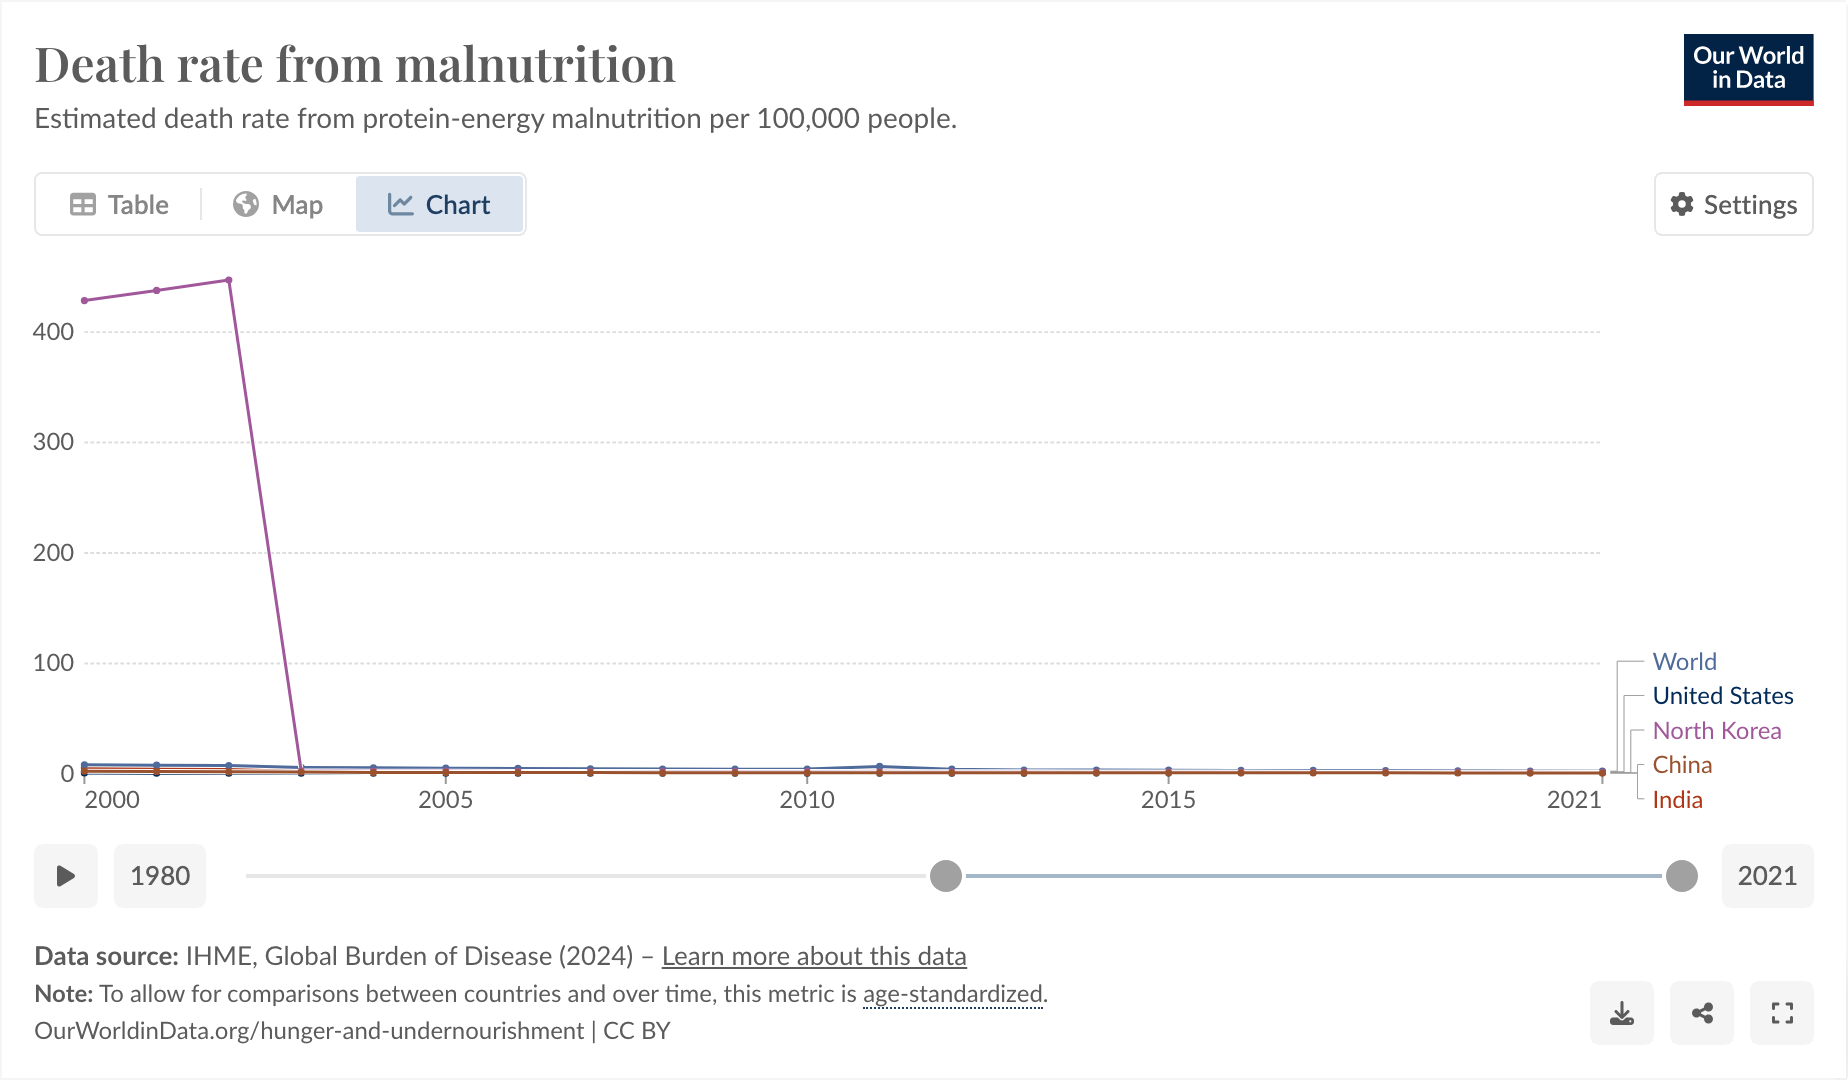
This is a weird one. Bear with me. From !dataisbeautiful@lemmygrad.ml:

So I said to myself, “that’s a little bit weird. The US one going up, I can actually believe, but the North Korea one being lower is definitely wrong.”
I think Our World In Data is just being shoddy, as they often do.
https://www.wfp.org/countries/democratic-peoples-republic-korea
The thing I found funny, and why I’m posting here, comes from observing why it was that they started their graph at 2003 and exactly at 2003.

I feel like you could use this as a slide in a little seminar in “how to curate your data until it matches your conclusion, instead of the other way around.”
And also, I don’t think the hunger rate suddenly dropped from epic to 0 exactly in 2003, I think more likely Our World in Data is just a little bit shoddy about their data.


Israel is already doing so much fucked up shit that there’s no reason to make shit up to make them look bad. They’re blowing up hospitals and schools, and shooting small children in the head. There’s no need to invent lies about nuclear weapons being used.
There always is. Some people just enjoy stirring up more drama. Some get money out of that.
Tearing down the very idea of objective truth, switching out sources and debate for a process based on ever-shifting chaos, yelling, and loyalty to a particular narrative above all else, is it own highly valued goal.